
Understanding the Carbon Footprint of Spill Response and Remediation
To gain a better understanding of the carbon footprint of our spill response and remediation works, Oracle Environmental Experts have been working with QuestGates and since the start of 2023, on all our completed projects for QuestGates, we have been using the QuestGates carbon calculator to establish where the bulk of our carbon footprint comes from in our works, and to establish how we can best seek to reduce it.
To illustrate the use of the QuestGates carbon calculator, we provide below two examples of the carbon calculator, firstly for a site where excavation and off-site treatment of kerosene contaminated soils was carried out (Case Study 1) and secondly for a site where in-situ treatment using soil vapour extraction (SVE) and in-situ chemical oxidation (ISCO) was completed (Case Study 2).
Case Study 1 – Excavation and Off-site Treatment
Spill Summary
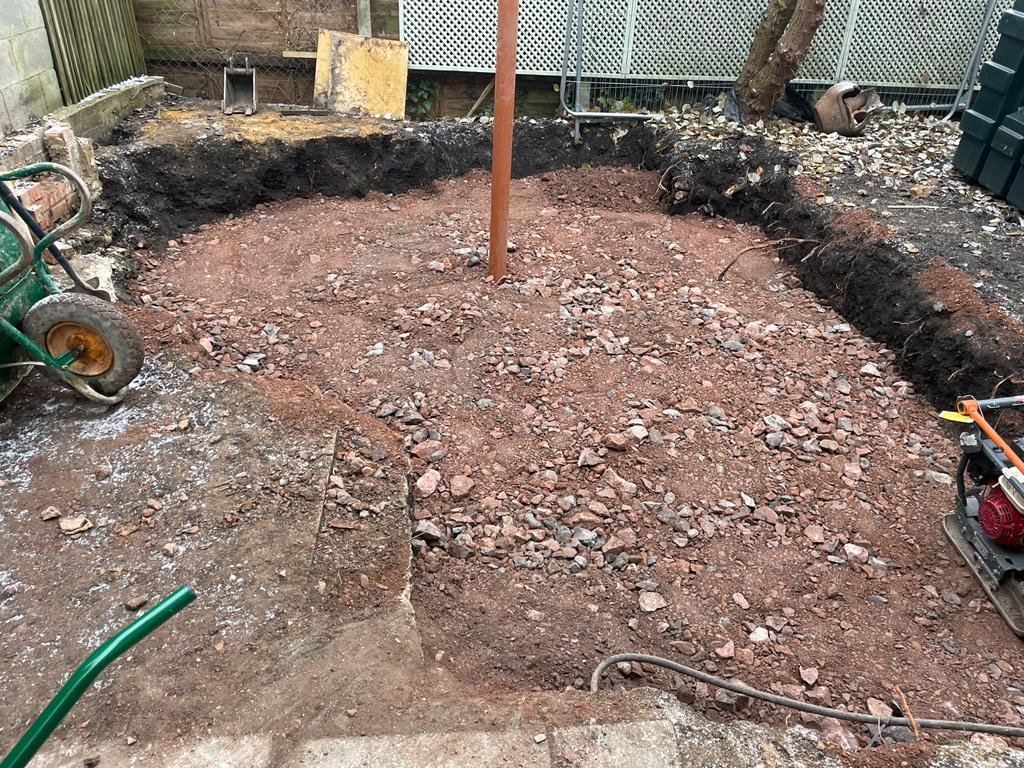
An unknown volume of domestic heating oil (kerosene) was lost to ground at a domestic property following accidental damage to a fitting attached to the oil storage tank serving the property.
The spilled kerosene resulted in the contamination of surface gravels, wooden decking and underlying soils within the property’s rear garden across an area of approximately 15 m2.

Remediation and Verification Works
To facilitate access to the works area, the property’s oil supply system was disconnected and relocated by an OFTEC registered engineer, and the oil storage tank’s supporting structure and surrounds were dismantled and removed from site.
Kerosene contaminated soils were then mechanically excavated across 15 m2 to a depth of 2 m below ground level. Delivery of plant/equipment (namely an excavator and site welfare) resulted in 8 Kg CO2e.
A total of 42.98 tonnes of kerosene contaminated material was removed for off-site treatment at a suitably licensed facility, resulting in 1,081.11 Kg CO2e. from waste haulage and treatment. A total of 55 litres of diesel was used to fuel the excavator, accounting for 183.01 Kg CO2e.

Reinstatement
Following verification soil sampling, the excavation was backfilled with appropriately compacted Type I MOT aggregate. The delivery of this material generated 2.67 Kg CO2e. and the material itself accounted for 651.50 Kg CO2e.
The garden’s surface was left unfinished as per the client’s request.
Carbon Summary
As can be seen by the below chart, ‘waste transport, reclamation and disposal’ was the primary source of CO2e on this project despite the waste being treated rather than being disposed of in a landfill, accounting for 1,081.11 Kg CO2e.
Travel was a close second, with 1,047.98 Kg CO2e. generated.
On site fuel usage accounted for 183.01 Kg CO2e.
Deliveries of plant equipment accounted for 8 Kg CO2e.
Deliveries of materials accounted for 2.67 Kg CO2e.
The total carbon footprint of the project was 3.05 Tonnes CO2e.

Case Study 2 – In-situ treatment using SVE and ISCO
Spill Summary
Filter bowls connected to the heating oil supply system at a detached cottage in Dorset failed resulting in the release of an estimated 250 litres of kerosene to ground adjacent to the property.
The kerosene had contaminated the concrete base and the soils beneath and in proximity to the filter bowls and the associated oil storage tank, and the contamination posed a risk to health, building structures, controlled waters and the drainage system.

Remediation and Verification Works
Owing to the location of the kerosene contaminated soils immediately adjacent to a main road and their raised level compared to the adjacent building structures, excavation and removal of the contaminated soils was not considered appropriate. Therefore, in-situ remedial options were trialled with the principal remediation technique adopted being SVE. A total of 14 no. perforated steel lances were advanced over a 10 m2 area and an SVE system was installed and operated for a 10 week period.

For polishing, 2 no. ISCO applications were completed using a dilute hydrogen peroxide solution applied under gravity. Over the treatment period mean exhausted VOC concentrations reduced from 78.31 ppm on the date of installation to 1.61 ppm during the final monitoring visit
On completion of the SVE and oxidant treatment, a total of 2 no. verification air samples were obtained from the property which confirmed internal ambient VOCs were at an acceptable level.

Carbon Summary
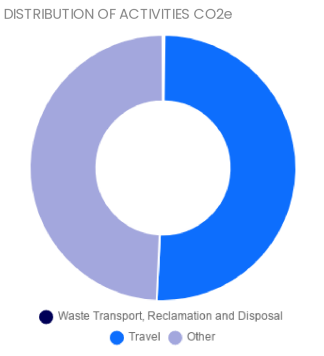
As shown in the below chart, the principal carbon footprint on this project was related to project travel accounting for 558.13 Kg CO2e. The ‘other’ component was primarily derived from the electricity usage associated with the operation of the SVE system which accounted for 543 Kg CO2e
Cement and mortar used in reinstatement of the work area on completion of remediation accounted for 322.35 Kg CO2e and pipes and drainage accounted for 9.35 Kg CO2e. Waste transport, reclamation and disposal accounted for 2.17 Kg CO2e
The total carbon footprint of the project was 1.44 Tonnes CO2e.
Concluding Remarks
We were able to establish using the QuestGates Carbon Calculator that by adopting an in-situ treatment scheme of works, we saved approximately 1.5 Tonnes CO2e compared to physical removal of contaminated materials and replacement with new. We are constantly reviewing and adapting our practices and systems to reduce the carbon impact, lifecycle, and the cost of our remediation projects.
The QuestGates Carbon Calculator has helped us identify and focus on areas where we can reduce our carbon footprint which have to be our transport fleet and those associated with waste haulage and equipment delivery and collection. Through continued use of the QuestGates Carbon Calculator we hope to make changes in our operations that result in a tangible reduction in our carbon footprint.